Platform
 Solutions
 Owners
 Contractors
 Engineering/EPCM
 Professional Services
 Resources
 White Papers
 Case Studies
 Blog
Blog Videos
 Frequently Asked Questions
 Company
 About
About“If you keep going at this speed, you’re going to be late!”
That’s my simplistic real-life analogy of earned value management. It’s a simple bit of math that we all do in our heads anytime we’re trying to get somewhere or finish something. If you gave yourself an hour to get there and after a half-hour you’re still less than half-way, you’re going to be late. It’s that simple. As simple as it is, it requires us to know quite a bit of information about the current situation in order to calculate late vs. on-time. Just like EVM, you need to know 3 key elements to make the calculation:
- Your speed
- Remaining distance to go
- Remaining time left

Cost Variance
If you know those 3 values, you can not only calculate whether or not you’re going to be late, but you’ll also know how late. In earned value management, the “how late” answer would be called Variance.
Whether we’re talking about time, cost or hours, variance is determined by knowing three things about your project:
- Your budget
- How much of that budget you’ve spent so far (actual)
- How much work has been completed (as a percent)
To save you from having to read it here, you can have a look at this site to get the details on the math for calculating variance (and any other earned value metrics).
Depending on your preference, variance can be expressed as a whole number or as a percent. Most people tend to speak about variance in percent terms since it gives you a sense of the magnitude. For example, “we’re 17% over budget.” It’s key to point out that that would be a variance of -17%. An overrun is always shown as negative. Click on the screenshot to the right to see some live variance metrics for a sample project.

That’s the quick explanation of Cost Variance or CV.
Schedule Variance
What about Schedule Variance (SV)? Schedule Variance is a bit different in that it swaps out Actual Cost and puts in Planned Value (PV). Then it subtracts the value of the work that has been completed (earned value – EV). To put them into words, CV is this, “What have I completed compared to what have I spent?” SV is this, “What have I completed compared to what did I plan to spend by this date?”
To understand SV, you need to first understand Planned Value. PV is figured out by calculating what you were supposed to have spent as of this date. That’s not always easy to grasp at first, so I’ll explain a bit further.
Planned Value assumes that you’ve linked your budget with your schedule. Again, a “budget” can be expressed in cost or labor hours (or any other metric). By linking budget and schedule, you not only know how much, but you also know when. Projects never play out as exact or linear lines of activity and cost. And, they’re never planned as being linear either. There are always peaks and valleys of activity and cost that create curvy lines of expenditures and burnt labor hours over time. Knowing on any one day what you had planned to complete is key for understanding whether you’re on schedule. Schedule Variance takes PV and subtracts EV to determine if you’ve completed more or less than you’d planned. If less, then you’re behind schedule, and vice versa. Click here for more details on SV calculations.
By far the most important factor for achieving reliable earned value results is to do accurate progress measurements. If your progress measurements are inaccurate or out of date, then your variance calculations will be relatively meaningless. Discussions around accurate progressing is beyond the scope of this article, but needs to be pointed out as a critical process of any project organization.
Roll-up Calculations
Progress measurements always occur at the level of the project where the actual work is being tracked and costed. It’s key to always plan, track and measure in the same place – usually at the task or work-package level of the project. The work breakdown structure, of course, is organized hierarchically.
As a result, progress measurements are performed several layers deep into the hierarchy – and by extension, all EVM calculations are performed at that same level. How then does the system roll-up those calculations to the higher levels of the WBS, and ultimately to the project as a whole? Have a look at the screenshot to get a visual on what I mean.
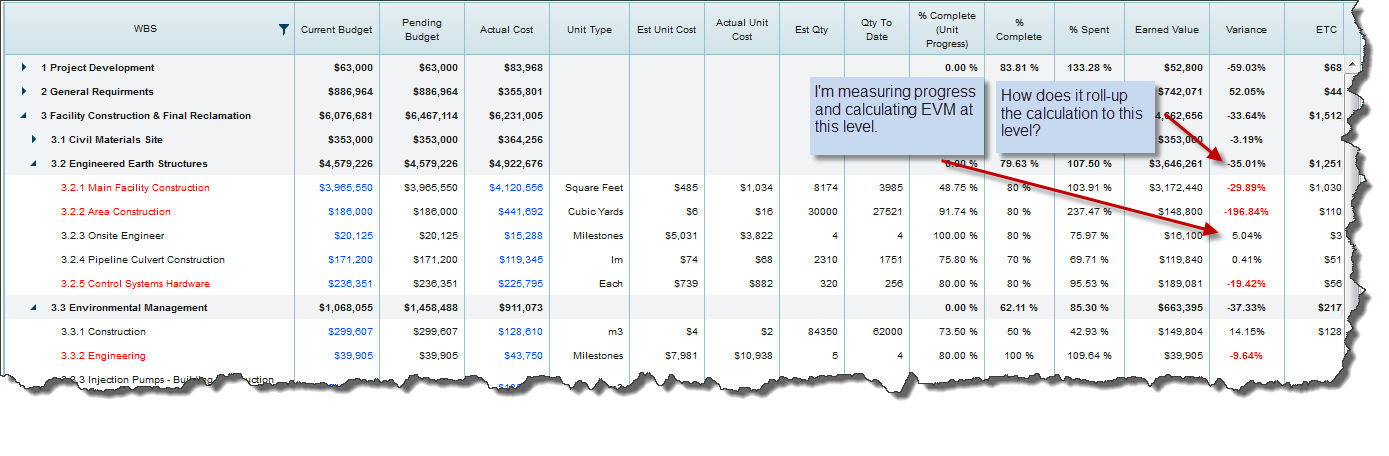
The answer to this: is that it takes the sum of all Earned Value (EV) values for the tasks in any folder, and back-calculates percent complete for the folder. It then repeats that for each level, all the way to the top of the WBS. In other words:
- Folder Budget (BAC) = SUM(task budgets)
- Folder Actual Cost (AC) = SUM(task actual cost)
- Folder Earned Value (EV) = SUM (task earned value)
- Folder Percent Complete (PC) = EV/BAC
All other EVM calculations can be performed from there.
I hope this is helpful, let me know if you have any thoughts or questions on this.