Platform
 Solutions
 Owners
 Contractors
 Engineering/EPCM
 Professional Services
 Resources
 White Papers
 Case Studies
 Blog
Blog Videos
 Frequently Asked Questions
 Company
 About
About
If any part of executing on your projects includes hiring subcontractors to perform work for you, I’m sure you’ve run into many situations where you question whether or not some of them are any good. So, how do you measure that? How can you easily gather performance metrics on your subs so that you can make key decisions?

Getting out of the Dark
Being in the dark about whether your subs are performing to plan is a very common frustration for project managers. They may be out there working every day and appearing as though they’re making good progress, but then they mysteriously surprise you at the last minute that things are taking longer than expected. Of course, there may be good reasons for it taking longer; but maybe not. And maybe it would’ve been good to know that two weeks ago, instead of them coming to you with the last-minute stunner. Being able to objectively measure subcontractor productivity is critical for project managers, so that they can make key decisions to keep projects running smoothly. It’s more than just measuring productivity however; it’s also vital to also to benchmark what their productivity should be. Regardless of the type of subcontractor, you need to establish the planned daily progress, so that you can compare the actual daily progress against that. But how do you do it? How do you objectively measure what they’re doing, as compared to what they should be doing? In this article, I’m going to discuss how the right software solution can provide you the platform for measuring Planned Versus Actual in terms of subcontractor performance. Not only that, but also provide real-time indicators of potential delays so that you can take swift action on problem areas. Additionally, the software can also keep historical records of performance from all subcontractors, so that you can establish benchmarks for expected performance – and then compare two or more subcontractors against each other to give you insight into their cost vs. time vs performance metrics.Planned versus Actual
Most every contract you engage a subcontractor in will have some measurable outcome for what it means to be complete. If it’s for Civil work for example, it might be cubic yards of dirt moved. If it’s a welder, it might be total welds, etc. For short-term work, monitoring incremental progress isn’t really necessary – but you’ll likely have multiple subcontractors that are at the jobsite for a long-term job that can span weeks or months completing their work. If your contracts are well written, there should not only be a clear understanding of measurable outcome, there should also be an expected daily average progress they need to perform at in order to achieve that final outcome on time. In those cases, monitoring incremental progress to compare against the expected daily average is critical to shed light on how well they’re performing to plan. Without comparing planned against actual progress, you won’t have any objective method for knowing where things are at. If, on the other hand, you don’t have an Expected-Daily-Average defined in the contract, you can always simply prorate the total deliverable quantity over the duration of the activity’s schedule. What I mean by that is, if you have 100 welds to complete in 10 days for example, you can evenly distribute the welds to be 10-welds-per-day.Here’s the First Way Software Can Help
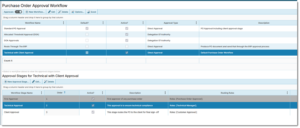
It’s tricky enough monitoring planned versus actual for one subcontractor, it becomes a beast to monitor and analyze dozens of them simultaneously. This is the first area that you can offload onto a software solution. Software systems are great at organizing and processing a lot of data all at once, and presenting it in nicely formatted reports & charts. In a bit more detail, here’s what the software platform will do. First of all, it will allow you to capture the planned daily average progress for any item of work. Most service-based contracts are written and costed as lump-sum amounts to perform the work detailed in the contract and associated technical documents. The system will allow you to capture all that information and much more in regards to the contract and expected outcomes. One key metric that can be captured alongside everything else, is “Progress Quantities”. Progress quantity is the measurable amount and rate that the subcontractor is hired to complete. For example, let’s say you hire a civil contractor to excavate 23,000 yd3 of dirt and haul to a stockpile. In this case, the progress quantities are as follows:- Planned Amount: 23,000
- Rate (UOM): Cubic Yards
- Planned Daily Average: 2,300
- Planned Amount: 23,000
- Planned Daily Average: 2,300
- Actual Daily Average: 2,170
- Total Actual to date: 14,210
Trending: Productivity Timeline Charts
The system can also provide trending details in the form of timeline charts that indicate whether subcontractors are trending upwards or downwards in terms of making improvements in their productivity. So, if that average daily productivity continues to perform behind plan – or even gets worse – you’ll be able to monitor that trend and take action if necessary. A project manager friend of mine calls it his “Kill Number”. I know it sounds a bit cutthroat, but it’s the point at which he defines as when he decides to cut his losses and fire the subcontractor.Weighing Productivity vs. Cost
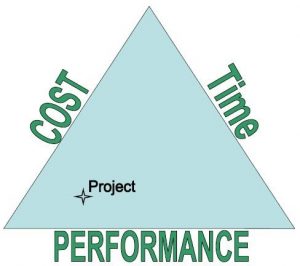
Achieving productivity expectations doesn’t necessarily mean the subcontractor is actually working to plan. They may just be throwing a bunch of extra guys at the job and expensing more to the project than was planned. Productivity goals still need to be met within the cost and labor-hour constraints originally set out in the schedule. This is another area where the system can be instrumental: ensuring subcontractors maintain expectations in both productivity and cost. The system can produce reports on many key metrics that will shed light on a subcontractor’s true performance. For example:- Planned Cost per Unit versus Actual Cost per Unit
- Planned Hours per Unit versus Actual Hours per Unit
- Productivity Index, including productivity trend chart
- Percent Complete
- Percent Hours Complete
- Percent Spent (cost)
- Scheduled Daily Average