 Platform
 Solutions
 Owners
 Contractors
 Engineering/EPCM
 Professional Services
 Resources
 White Papers
 Case Studies
 Blog
Blog Videos
 Frequently Asked Questions
 Company
 About
AboutCONSTRUCTION REPORTING & ANALYTICS
Transform Data Into Actionable Insights
- Customizable Dashboards, Reports & Analytics
In addition to the many built-in reports and dashboards, 4castplus includes report designers that enable your teams to build their own dashboard reports, charts and custom templated reports. There’s no limit to the ways you can tailor the reporting to meet any need. All reports are also interactive so that you can mine the data on-screen; then export the result to a formatted report for further analysis.
Visibility
"4castplus Provides Powerful Tools & Reporting
To Manage All Our Projects."
“With built-in EVM and analytics, we now have key information to address issues quickly. Eliminate all double handling of data – avoid delays, see everything in real time.”
ODG Fire & Mechanical
Project Reporting & Dashboards
Powerful, Interactive Reports in One Click
4castplus is abundant with reports throughout the system. It has been designed to enable users to quickly access interactive reports on all aspects of projects, programs, resources, vendors, changes, contracts, billings, status, and much more. Regardless of the reporting interface, 4castplus has adopted a “One-Step-To-Excel” philosophy that enables users to export any report to Excel for printing and further processing.
User-Designed Reporting
To compliment the hundreds of reports out-of-the-box, 4castplus includes tools for users to create an endless number of customized reports, charts, report templates and custom forms.
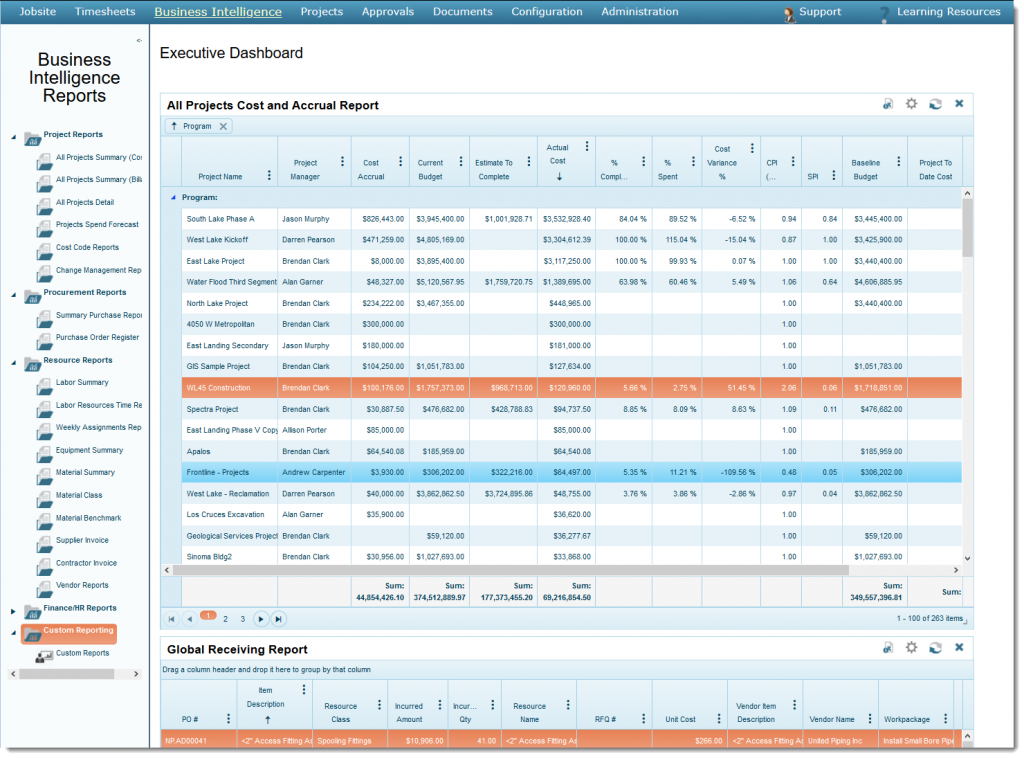
Business Intelligence Reporting
The business intelligence area of 4castplus provides a diverse array of corporate-level reports for monitoring and drill-downs on current and historical data. Tap into benchmark reports, rollup reports, summary reports and an executive dashboard to view your projects strategically.
Productivity Reporting
4castplus includes performance metrics that span the many ways project teams need to see their data. Including productivity on crews, subcontractors, activities, programs, project managers, even customers.
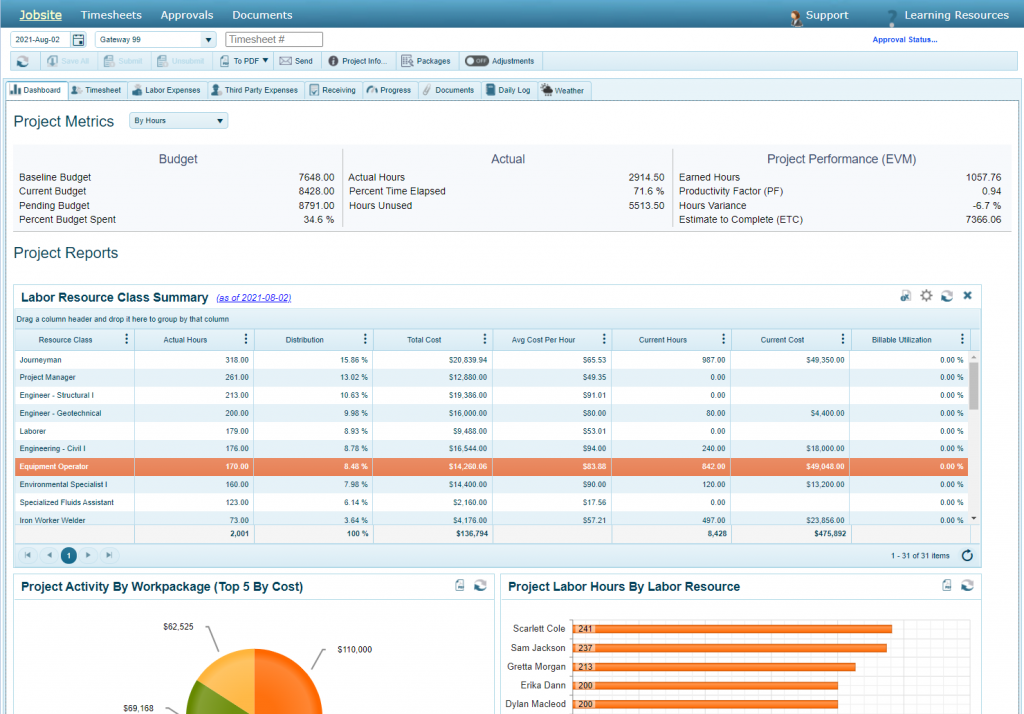
Jobsite Analytics
Deep Insights Into Jobsite Data
To complement the strength in jobsite tracking in 4castplus, comprehensive construction reporting and analytics are included out-of-the-box to enable field personnel to deep-dive on a vast array of field data. From labor hours to physical progress, to equipment on site to materials consumed, 4castplus delivers it all in easy dashboards and reports.
- Daily job site and field ticketing reports
- Field receiving and materials
- Management reports
- Daily log reports
- Safety and HSE reports
- QA/QC and inspection reports
- Transmittal reports
- Submittal and document reports
- RFI reporting
- Physical progress and progress timeline reports
A Wealth Of Construction Project Reporting Options
The suite of 4castplus tools enable users to enter a vast amount of project information on a daily basis. From estimates to purchase orders, jobsite tracking to change orders, progress measurements to forecasts, timesheets to customer invoices and so much more. With these thousands of data elements, 4castplus truly delivers on a powerful network of reporting tools to visualize, report and pivot this information. 4castplus enables companies to leverage their data as an asset – a valuable commodity that is critical to their business success.
- Frequently Asked Questions
Spreadsheets require manual data entry, making them error-prone, time-consuming, and difficult to scale. They also lack real-time updates, leading to outdated reports. 4castplus automates reporting, providing instant, accurate insights without the inefficiencies of spreadsheets.
4castplus includes built-in reports, ad-hoc reports, benchmark reports, productivity reports, EVM analytics, and customizable dashboards. Users can design tailored reports and export data for further analysis. Reporting can be tailored to suit any specific need and run in a single click. Users can run project reports broken out by WBS or Cost Codes. Or transactional reports, resource reports, profitability reports, progress reports. As well as reports on PO receiving, expediting, commitments, requisitions, RFQs and much more.
4castplus transforms raw project data into actionable insights by offering drill-down reporting, interactive dashboards, and corporate-level analytics. This enables project managers and executives to make informed decisions based on real-time performance metrics.
Yes. 4castplus has a very powerful designer tool for users to build an unlimited number of dashboard reports and dashboard charts. Users can select from hundreds of data fields across multiple datasets to design dashboards for any purpose. Dashboards can be either project-based or global in scope. Project dashboards report specifically on the project, and the global scope provides corporate and executive dashboards that report across many projects, divisions, resources, customers, etc.
Yes, 4castplus provides a module that allows you to attach PowerBI (or other analytics tool) to your 4castplus data. The 4castplus BI Analytics Platform is a reporting server with a SQL database populated with your latest 4castplus data. Attach your favorite BI tool or data warehouse application to build your own analytics dashboards & reports, or merge 4castplus data with other enterprise data for a full corporate view.
Yes, there are dozens of prebuilt reports that cover a wide range of datasets and reporting requirements. These reports can be found throughout the system and are launched in a single click.
Yes, there are many timeline and cash flow reports for analysis, forecasting and planning. This includes: S-Curve, resource curves, spend forecast, revenue forecast, trend reports and a lot more.
Project and program level reporting
Performance and productivity analytics
Benchmark reporting for estimating and budgeting
Timeline
reporting
User-customizable dashboard charts and reports
Drilldown
reports
Project & program level reporting
Performance & productivity analytics
Benchmark reporting for estimating & budgeting
Timeline
reporting
User-customizable dashboard charts & reports
Drilldown
reports