Platform
 Solutions
 Owners
 Contractors
 Engineering/EPCM
 Professional Services
 Resources
 White Papers
 Case Studies
 Blog
Blog Videos
 Frequently Asked Questions
 Company
 About
AboutRead In 12 Minutes
Part 2: Cash Flow Forecasting During Project Execution
Part 1 of this article discussed the key elements that need to be structured in the project plan to set it up for project forecasting once the project is underway. In Part 2, we’re going to be examining the actual cash flow forecasting techniques and processes that take place while the project is underway. For those who are relatively new to project forecasting, it may seem like there’s a lot of structure and process that needs to be in place to produce a forecast. More than you may have expected. To be clear, plotting out a simple forecast that just takes the project budget and subtracts actual costs to date would not need any of the process or structure that are proposed here. That type of forecast, however, would only show you the remaining budget over a timeline. While quick and simple, it would be of very limited value. What this article is meant to provide is the methods for accurate forecasting. A model that considers various key metrics such as progress, productivity, performance, remaining work, potential changes, and variances, to name a few. While it’s true that this method requires more effort, planning, and process, it results in a forecast that is not only accurate, but defensible and reliable.
So, starting with a discussion around process, we’ll then look at the 4 cyclical forecasting activities that happen in iterative project periods: Tracking, Measuring, Analyzing, and Forecasting.
Here are the 6 key tips for accurate project forecasting during project execution.

1. There Needs To Be A Good Process In Place
Iterative Reporting and Forecasting Periods
A project forecast is not a one-time thing. It’s done repeatedly and incrementally throughout the duration of the project. It’s typically aligned with what you lay out as your standard project reporting periods. In this case, you’re doing more than just reporting. As we’ll discuss in the sections below, you’re first measuring, analyzing and forecasting before reporting.
As a project team, it’s therefore important to define an iterative, repeatable process for how and when progress measurements and forecasts are going to take place. The importance of a process can’t be understated as it enforces a standardization and routine that gets followed reliably and consistently. This is similar to how your finance department works in continuous reporting periods. Let’s say, for example, you set up your period cut-off (or period close) to be bi-weekly. In this case, you’d set up your ‘reporting period’ to be fixed on a certain day at the middle and end of each month, where you’d submit the progress measurement, forecast, and associated status reports. This would then lock down that period; after which you’d open the next period, and on and on throughout the duration of the project. After submitting the progress measurement, the system will take a snapshot of the project data at that point in time and lock the data so that it remains fixed. The resulting data from the measurement and forecasting periods can then be charted on a timeline to visualise key project trends. It also enables users to analyze data at fixed points in time.
The charts below show some example metrics and how they trend over several progressing & forecasting periods. Each node on the curves represents a progress measurement and reporting period.
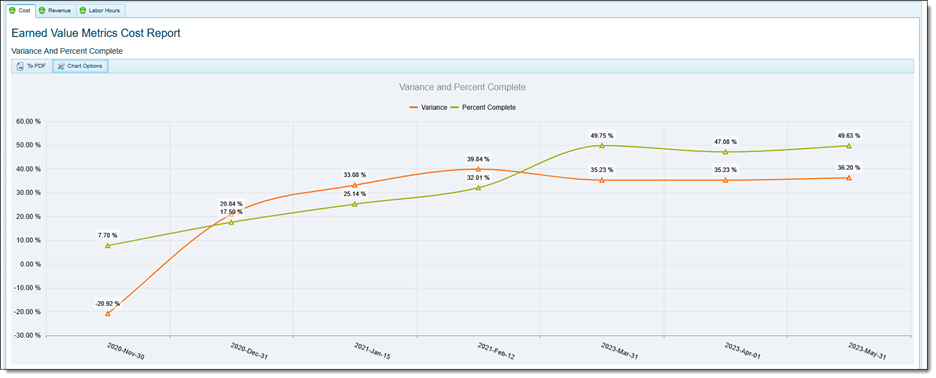
Figure 1 – Key Project Metrics Trended Over a Timeline and Divided into Reporting Periods
Learn More About Construction Reporting
Continuous Information Capture By The Wider Team
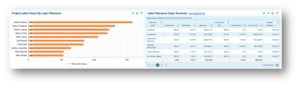
In order for a forecast to be accurate, there needs to be a reliable capture of the project actual costs. Ideally, costs are collected in real-time or near-real-time. We’ll go deeper on this subject in the Project Tracking section below. An important process consideration is to engage the whole team to contribute to information collection. This not only spreads the burden of effort in tracking across multiple people and teams, it also pushes the tracking to closer to where the activities and costs took place. Such as when tracking field costs directly from the field.
To ensure a distribution of effort, a successful process must also include the regular capture of progress, cost, hours, etc., from the wider team – including those at the jobsite, subcontractors and suppliers. It’s likely that this project tracking is already in place to some degree and, as we’ll see in the next section, may only require that the information tracked be automatically routed to the correct codes and WBS activities in real-time, and serve as natural inputs to the current period’s progress measurement.
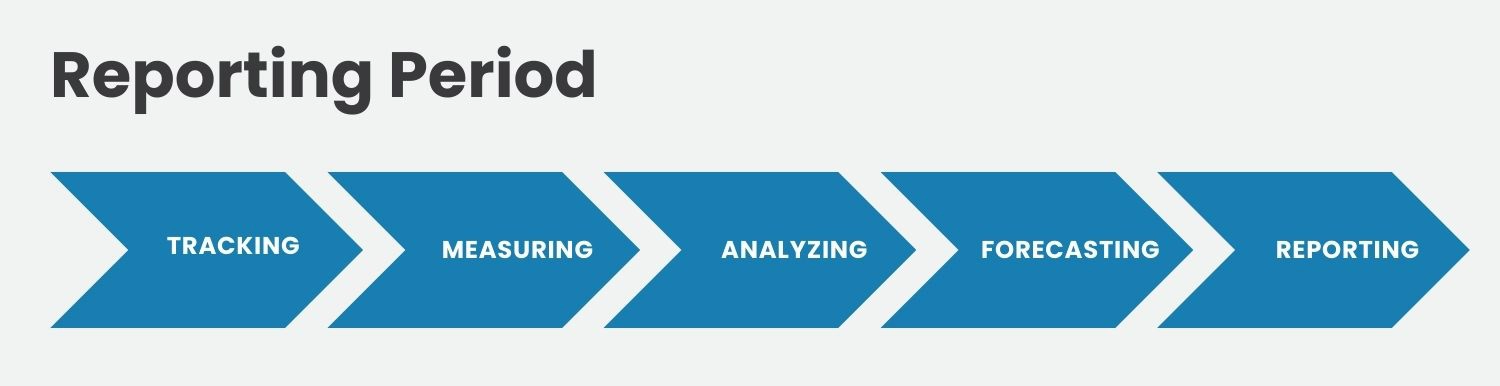
The 5 Elements to Project Reporting
With good planning and a good process in place, project execution becomes streamlined, productive, and much more accurate. In this section, we’ll tackle the five primary elements of project execution:
- Tracking: Capturing daily construction costs and progress
- Measuring: Creating incremental progress measurements for activity and project percent complete
- Analyzing: Applying critical analysis on the cost and progress results to ensure the numbers are correct and defensible
- Forecasting: Identifying trends and potential changes that could influence budget and schedule
- Reporting: Producing regular status, cost, and progress reports for project stakeholders at the end of each reporting period. Once this is complete, initiate a new measurement and reporting period to repeat the same.
As mentioned above, the execution phase should be divided into incremental reporting periods where a period cut-off is applied to benchmark that snapshot in the project’s lifecycle.
2. Project Tracking
Project tracking should be a rigorous process of capturing every detail of a project underway. Hours burned, items installed, activities completed, materials delivered, etc., should be tracked and routed back to the project management team as cost and progress metrics for the project. Tracking should be continuous – ideally on a daily basis – and available to the team in real-time or near-real time. This gives early insight into any issues that may be happening that require corrective action, and provides the project controls team with core information to determine what to forecast. Don’t wait until the end of the reporting period and pull an all-nighter to cram in all the cost and progress entries. The constant act of project data capture should be embedded within the overall daily process.
Remember, tracking is a key input to measuring, and measuring is a key input to forecasting. In other words, everything is connected; so, the better the accuracy of your tracking, the better the accuracy of your analysis and forecasts. Note also, that tracking isn’t just about capturing labor hours – the main purpose of tracking is to compute your current project cash burn, along with computing current physical progress on the project.
For example:
- Daily costs, hours and progress are captured by your field personnel
- Subcontractors are submitting progress claims, or hours or invoices – which recognize cost and progress
- Suppliers are delivering materials, etc. which incur cost on the project
- Other indirect costs for labor, equipment and other expenses are captured
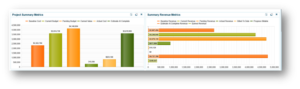
As we saw above, when plotting actual cost on a curve, you should be able to monitor it as it compares to budget. Figure 2 below demonstrates how Actual Cost in the yellow line compares against budget (blue line) as the project plays out over time.
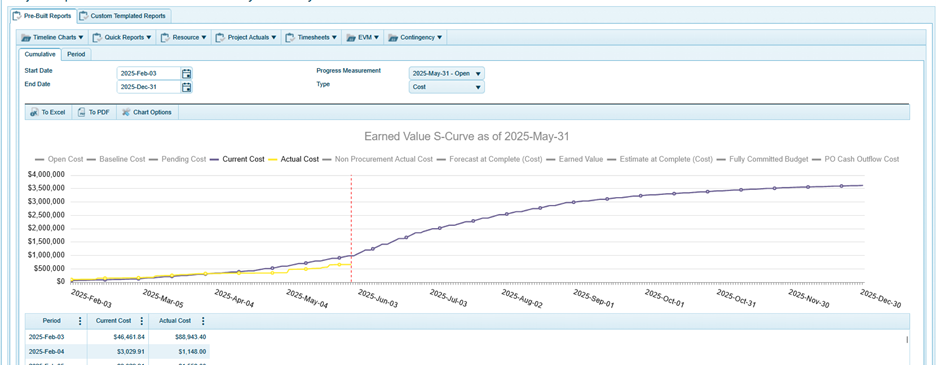
Figure 2 – Budget vs. Actual Timeline Curve Report
3. Measuring
The data that’s used to measure a project’s progress should be largely derived from the cost tracking and data capture described above. At the time of submitting a progress measurement, therefore, all the data that feeds that progress measurement should already be captured and ready for review and analysis. In other words, if the project has been set up so that it’s easy to measure, the effort required for the progress measurement should be a relatively straightforward practice of overseeing that the process has been followed, and information capture is complete.
Figure 3 below shows a section of a sample progress measurement. It’s the percent complete column that’s being calculated as part of the progress measurement, which is then used in conjunction with budget and actual cost to calculate other metrics such as CPI, ETC, CV, EAC, etc. These other metrics will be utilized by project controls in the analysis and reporting on the health of each phase of the project.
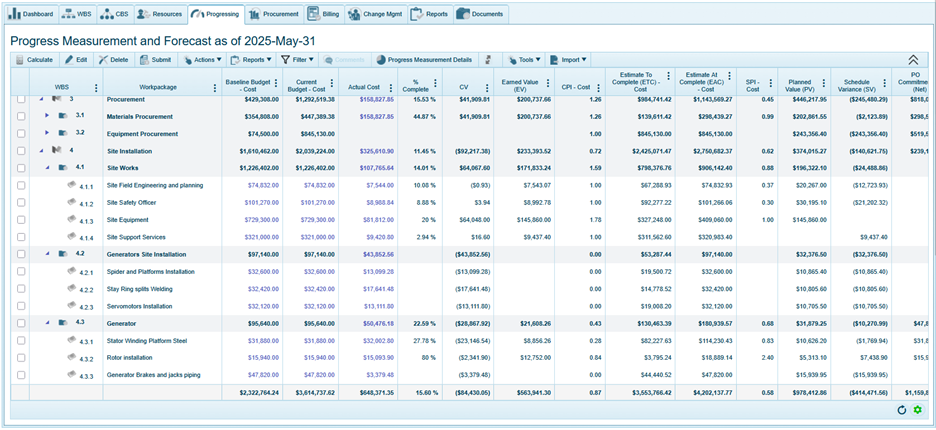
Figure 3 – Sample Progress Measurement
As you can see, percent complete is calculated based on a true indicator of physical progress. Which, in that case, is the actual completion of production quantities. Not only is that a reliable and defendable progressing method but the effort that project controls had to put into that progress measurement is relatively small. That’s primarily because they did most of the legwork during planning; and equally, enforced a good process for capturing the right information to feed the progress measurement.
The question remains then: can the numbers be trusted? The answer to that lies in the next stage, Analyzing, which is where project controls oversight comes into play.
4. Analyzing
It’s during the analysis stage that the work of project controls truly kicks in. When tackling the results of a progress measurement that’s largely automatically generated, they’ll first want to check for any anomalies or outliers and fix any data capture mistakes or gaps. To confirm whether any EVM result is a true reflection of a task’s current productivity, there are a few things to double-check prior to assuming any corrective action needs to be taken:
- Start by ensuring that cost and progress have been fully captured and entered. If, for example, all the production quantities haven’t yet been entered, that can undervalue the percent complete and negatively skew productivity numbers.
- Next, compare metrics like percent complete and CPI against the previous reporting period(s) to see how this activity has been trending. It could be that a CPI of .55 for that activity is an improvement over the previous reporting period, or equally possible, a decline from the last period.
- Next, it’s imperative to consult with the project management team, who are likely more acutely aware of problem areas and can shed light on why the productivity is showing that low.
Ultimately, it may be the case that a CPI of .55 for a task is legitimate and some actions need to be taken to get it back on track. Maybe the budget was underestimated. Maybe the costs are coming in much higher than expected. Maybe it’s weather-related. For each scenario, there are a broad number of issues that could be identified that are causing the underlying lack of performance. Identifying the issues – along with the associated corrective action – is an integral part of the analysis and correction stage of each reporting period.
It’s this analysis and corrective actions that will feed the information for what needs to be forecasted; which we’ll discuss in the next section.
5. Forecasting
Project Forecasting is a methodical and process-driven science. While it’s largely manual and subjective, it must be undertaken using strict and auditable methods to ensure it’s defensible. Remember, not all activities need to be forecasted in each reporting period. Only those activities that are not playing out as initially planned, or those that are at risk of being influenced by previously unforeseen forces and need to be addressed. A forecast can be considered a precursor to a Potential Change Order. Unlike a change order, however, a forecast is a well-informed prediction of trends that are arising that need to be identified and captured prior to a change order. Any predicted trends that turn out to be true can then be converted into a change order and become part of the project budget & schedule. The forecast should be submitted as a package along with the progress measurement for approval.
6. Reporting
The project forecast data should be included in the standard project status reporting package delivered to all project stakeholders. Reports can be charts, timeline curves, or tabular in nature, showing baseline, current and forecast budget & schedule. It’s highly recommended to also produce timeline reports showing comparative curves of budget, actual and forecast.
The value of reporting on a submitted progress measurement is that all the data is aligned to a point in time. This is very important as data can change constantly. You need to be able to associate values such as progress, budget and actual cost at the identical instance to avoid anomalies in the calculations.
Learn More
Want to see how 4castplus turns timesheet data into real project insight? By capturing labor hours directly from the jobsite and linking them in real time to cost codes, budgets, and progress, 4castplus gives teams immediate visibility into labor cost, productivity, and project performance. Identify issues earlier, reduce manual handoffs, and use the hours you’re already collecting to protect margins and keep projects on track.