Platform
 Solutions
 Owners
 Contractors
 Engineering/EPCM
 Professional Services
 Resources
 White Papers
 Case Studies
 Blog
Blog Videos
 Frequently Asked Questions
 Company
 About
AboutRead In 9 Minutes
Many EVM professionals would argue that Planned Value is one of the most important metrics in earned value analysis. It not only represents an indicator of expected cash flow at any point in time on a project, but it also provides the critical benchmark from which numerous other metrics are being compared. For example, comparing budget versus actual.
What is Planned Value?
To give you an idea of what planned value (PV) is, consider the example where you have a $10 million project that is scheduled to take 10 months to complete. An important aspect of project controls is to be able to plan out how and when that $10m will be spent over the 10 months. It obviously won’t be spent all at once in one single lump. Neither will it be spent in an even, perfectly distributed rate of $1m per month.
The project spend will follow an uneven pattern – loosely following the schedule of activities, expenses and purchases that occur over the project’s duration. Planning the budget over the project’s timeline to create a cash flow forecast, is called Time-Phased Budgeting. Each activity on a project will have its own cash flow plan that is time-phased according to how that activity’s budget is forecasted to be spent. When the system aggregates all the cash flow plans of all the project’s activities together, it can create an overall cash flow forecast for the project.
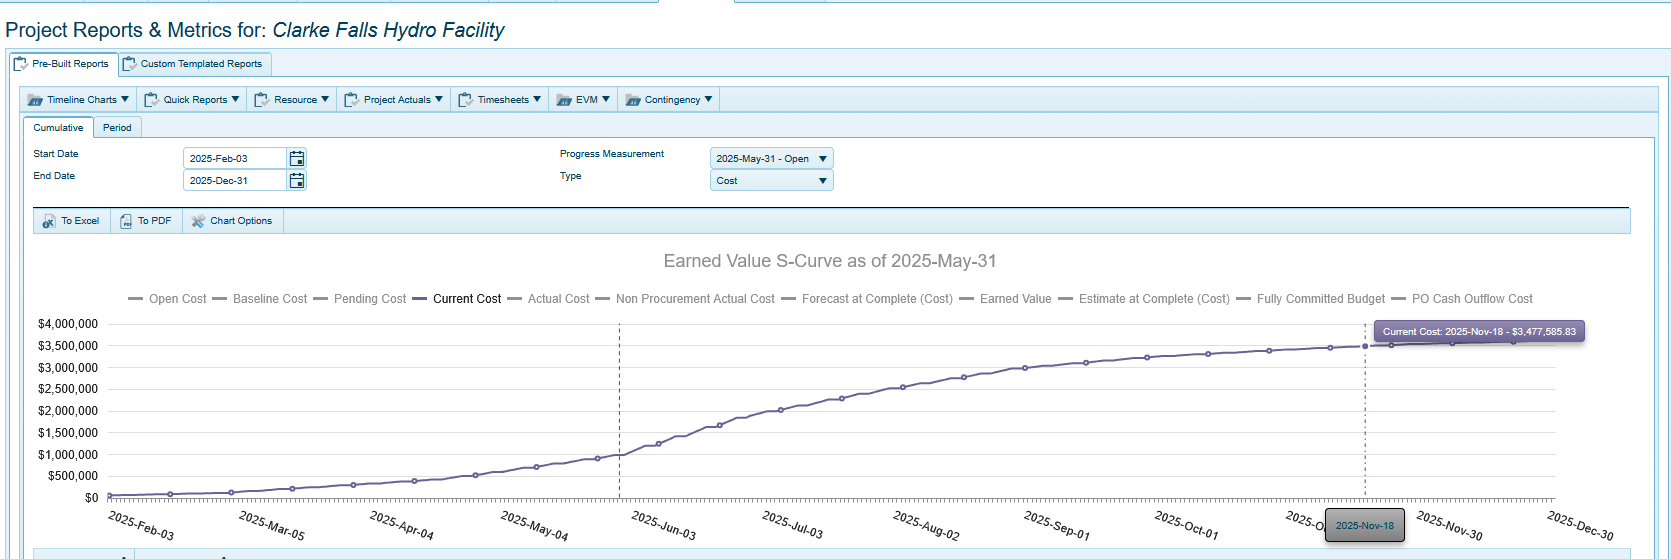
Looking at the 4castplus screenshot above, the blue curve that I’ve enabled on that chart is the project budget over the duration of the project. It represents an accumulation of all the planned expenditures and when they’re anticipated to be spent. I’m hovering my mouse over the curve on November 18th. The popup tells me that on that date, the total accumulated project spend will be almost $3.5m. That number represents Planned Value for that date. Planned Value is the value of scheduled project spend at a point in time of a project’s duration. Planned value is also referred to as Budgeted Cost of Work Scheduled (BCWS). So, it is really showing the intersection of cost and time.
Why is Planned Value so Important?
Calculating Planned Value is dependent on there being a time-phased budget in place for the project. By time-phasing the budget, project controls can determine what the expected budget outlay is planned to be at any point during the project. Once that 10-month project has been underway for two months, for example, a PV calculation will tell you how much of that budget was supposed to have been spent by that point in time. The answer, as I’m sure you’ve guessed, is unlikely 20% of that 10-month project. The calculation has to take into account every item or activity budgeted on the project; and determine when exactly the cost is expected to be incurred for that item or activity, based on its scheduled time of completion or delivery. Calculating PV therefore, requires a complex algorithm based on what, when and how much to that point in time. We’ll talk about the details of the calculation further down – what’s important to understand, is that this calculation can determine PV to a precision of a single day. In other words, I can pick any date on the calendar – as shown in the image above – and the system will return PV for that day. This is very powerful because PV is being used to compare against Actual Cost and Earned Value to get a picture of the project’s performance and health at any point in time.
Comparing Planned Value against Earned Value and Actual Cost
Comparing PV, EV and AC is the fundamental building block for all further EVM calculations and analytics. In order to obtain an accurate and relevant comparison of these three metrics, they all have to be aligned to a single day. These three metrics tell us the following:
- Planned Value: The progress that was planned to be completed by this date
- Earned Value: The actual progress that has been completed at this date
- Actual Cost: The actual costs that have been incurred to this date
In an ideal scenario, these three values should be the same – or reasonably close at least. Calculating Actual Cost (AC) to a single day is relatively straightforward as long as you have up-to-date cost information available to you. Actual cost is typically recorded transactionally – and each transaction occurs on a specific date – so to get the value of AC at a point in time is simply a matter of summing all the transactions to a date. Determining Earned Value (EV) is obviously trickier since it relies on a progress measurement as of a certain date; so, it’s typically the progress measurement status date that is used to align these three metrics. Click here for more information on Progress Measurements and how they feed into the calculation of Earned Value.
The role of PV is significant in this analysis since, without it, EV and AC are practically meaningless. If they can’t be compared against what was planned, they’re just numbers.
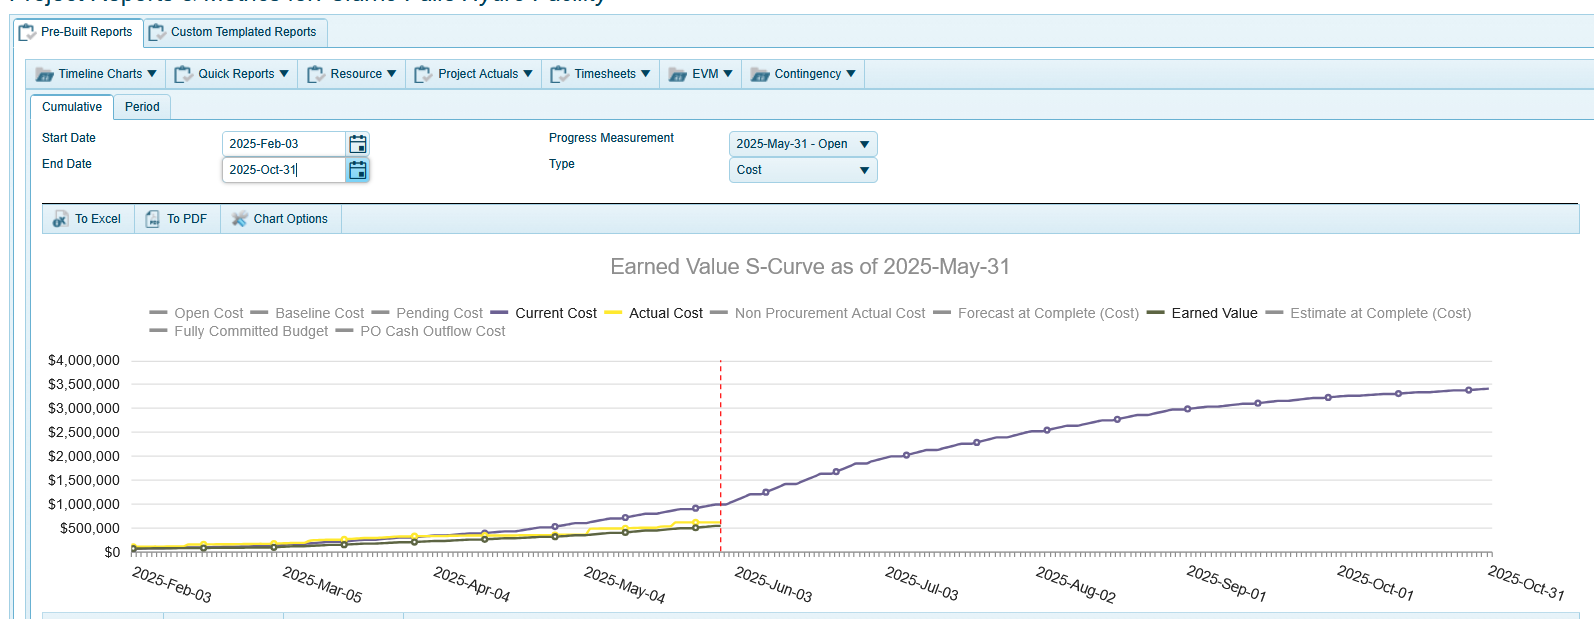
In the 4castplus screenshot above, I’ve enabled two more lines on that S-Curve chart: Earned Value and Actual Cost. The status date of May 31 is represented by the vertical dashed line, which is derived from the progress measurement I’m using in this report. A quick scan of the three curve lines shows that AC and EV are substantially below Planned Value. This is an excellent early warning that the project is running behind plan. On top of that, you can see that the AC line in yellow is slightly higher than the EV curve in brown. This reveals that we are spending more than we’re achieving, which is an early indicator that we are running over budget.
With this knowledge of PV, EV and AC, the system can produce many more EVM metrics that shed light on how well the project is performing, and how it’s forecasted to perform.

In the S-curve screenshot above, I’ve now added the Estimate to Complete line (ETC) in orange to indicate an adjusted cash flow forecast based on historical performance as-of that status date. The system is telling us that the project will end up over budget if we don’t course-correct.
Baseline Budget Versus Adjusted PV
Planned Value is of course subject to change over the course of a project’s life. This is a result of scope changes, schedule changes and unplanned productivity issues that result in change orders added to the project. PV for any status date will therefore adjust according to any approved budget and schedule changes that have occurred on the project. It’s important however, to ensure that the baseline budget and baseline schedule have been locked and are available as a reference point so that project controls can clearly see the delta between what was originally planned (baseline) and what is currently planned.
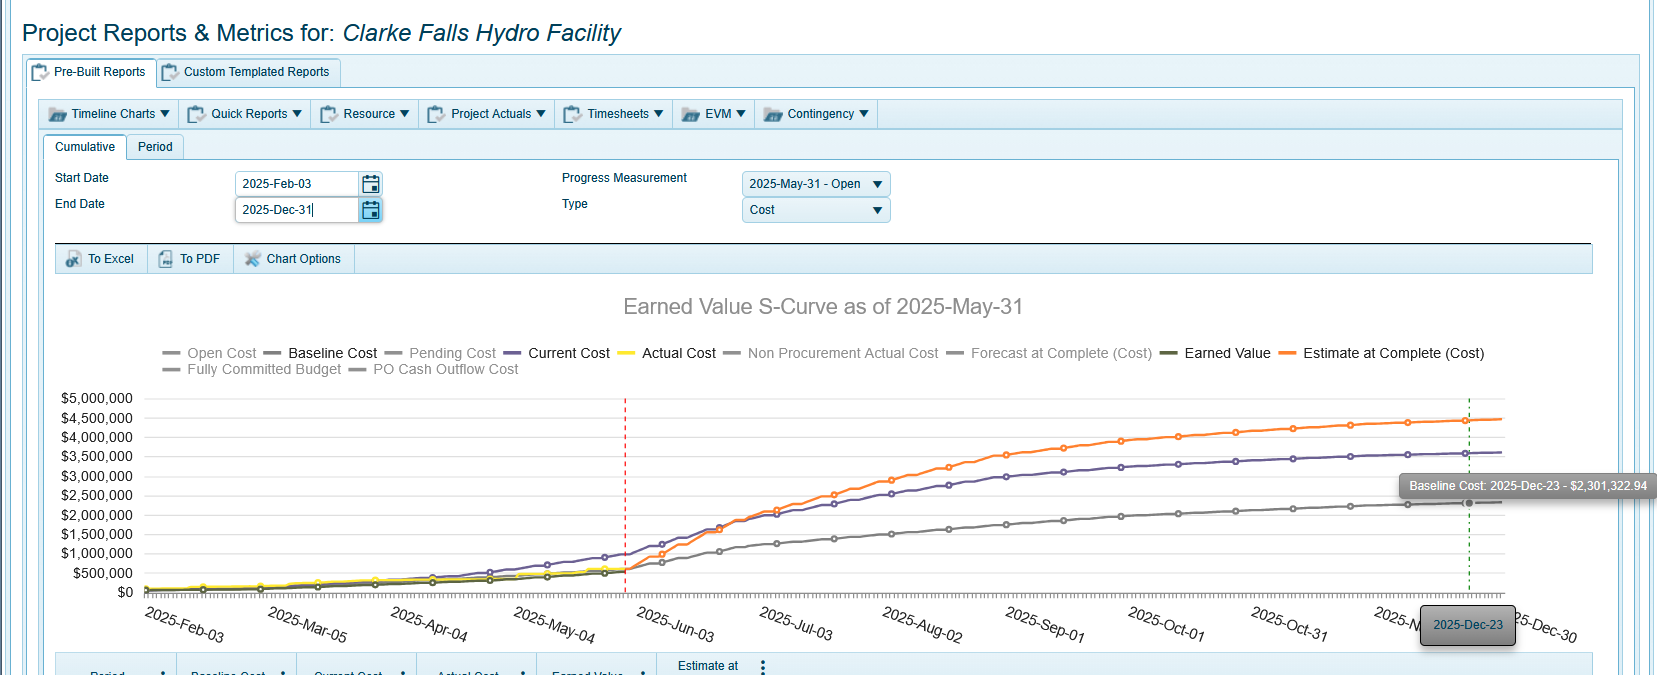
I’ve enabled another line on that S-curve chart above, Baseline Budget. This indicates the project’s starting point for its planned budget. The current budget holds any approved change orders and their time phasing, and what is used for planned value.
Schedule Variance and Schedule Performance Indicator (SPI)
Planned value is also used in the calculation of both SV and SPI. As mentioned above, Planned Value relates to the schedule in that budget items & activities are time-phased. Calculating schedule variance is done by simply subtracting Planned Value from Earned Value:
Schedule Variance (SV) = Earned Value (EV) − Planned Value (PV)
This formula is saying, “Take the value of the progress completed to date, and subtract what was planned to have been completed, and that’s the variance in schedule.” A negative SV means you’ve completed less than expected by this point, so you’re behind schedule. Most project managers also like to see SV in the form of a percent:
SV % = Schedule Variance (SV) ⁄ Planned Value (PV)
SPI also uses planned value in its calculation. SPI is a key performance indicator that shows how efficiently time is being utilized on a project. A value of greater than 1 means that your project is running better than planned efficiency – and a value less than 1 means less than planned efficiency.
SPI = Earned Value (EV) ⁄ Planned Value (PV)
Calculating Planned Value
PV calculation is a complex algorithm that takes into account all budgetary items & activities, and how their anticipated spend will be incurred over the time-phased planning of each item. These budgetary items can be a combination of labor hours, materials & equipment costs, third-party expenses, fees, consumables, etc. Each item will completed or delivered at different points in time – and it’s at that point that PV calculation considers that activity or item as incurring a cost on the project.
The PV algorithm essentially tallies up all these elements as of the required status date.
Accounting for Non-Workdays
There is an additional complexity with calculating PV that has to take into account non-working days according to the project work calendar. Let’s say for example you have an engineering drawing that is estimated to take 10 days to complete. The algorithm can’t just assume that that will be 10 continuous work days. It has to look at weekends, statutory holidays and other non-productive days that may be planned in the scheduled start & end date of that activity.
Can you calculate PV in a spreadsheet?
Organizations that have adopted EVM as a key project analysis and controls methodology will really struggle with calculating planned value without an EVM-ready software solution. It’s generally too complex to calculate using a spreadsheet. Using a dumbed-down calculation in a spreadsheet will deliver only a vague estimation of PV and provide little value. A calculation such as Total Budget (BAC) * Percent Time Elapsed, for example, assumes that the project spend will occur in an even linear pattern. And we all know that’s just not true. Additionally, there is not just one value for PV. There is a PV for every day of every task or activity on the project. That can be thousands of values to calculate.
Learn More
Want to see how 4castplus can help your teams work smarter together? From real-time field reporting to integrated cost control and streamlined change management, 4castplus connects every part of your project in one platform. Explore how our solution improves collaboration, boosts profitability, and gives you the visibility to keep projects on track—schedule a demo or learn more today.