Skip to content
 Platform
 Solutions
 Owners
 Contractors
 Engineering/EPCM
 Professional Services
 Resources
 White Papers
 Case Studies
 Blog
Blog Videos
 Frequently Asked Questions
 Company
 About
AboutRead In 5 Minutes
The Role of Timesheets in Job Costing
Timesheet tracking for the purpose of job costing and payroll is widely embraced as an activity that field crews will do at the end of a shift at the jobsite. Whether they’re using paper or an app or a spreadsheet, most contractors require this type of tracking for, at the very least, compliance with any regulatory requirements.
1. Production Tracking
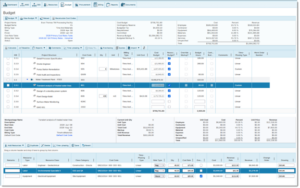
What is perhaps less common in this daily tracking routine, is to record any physical completions or quantities installed. In other words, tracking what was completed on that day, or up to that point. Furthermore, backing up those quantities with evidence of their completion. Understandably, ‘production tracking’, as it’s called, is more commonly done when the quantities tracked will result in earned revenue – such as in a Unit Price or BOQ project. However, production tracking provides many more valuable insights into project performance, progress, productivity metrics, and should be considered a mandatory activity for any contractor.
The 4castplus screenshot above shows the “Progress” area of the Daily Jobsite module. This module enables field staff to simply enter completed quantities on any of the work packages that were worked on on that day. It also provides a Comments section, along with the ability to attach documents to any line. Documents are for any inspection certificates or other evidence supporting the progress claim. You can see that it shows the total budgeted quantity for each work package, along with quantity to date, remaining quantity and today’s quantity. Those values get saved and submitted along with other field tracking such as labor & equipment hours, expenses, daily log, etc. This means that the system can then correlate the production quantities completed with the hours and costs it took to
Learn More About Jobsite Cost Tracking
1.1 Expected Versus Actual Daily Quantity
As part of the project plan, you can enter the Budgeted Quantity for any work package. This represents the expected number of “Units” that are to be completed as part of the contractual obligation to complete the task. This quantity could be of any unit-of-measure, such as linear feet, cubic meters, units, lot, lump-sum, bolts, welds, cables, an on and on, depending on what is being measured.
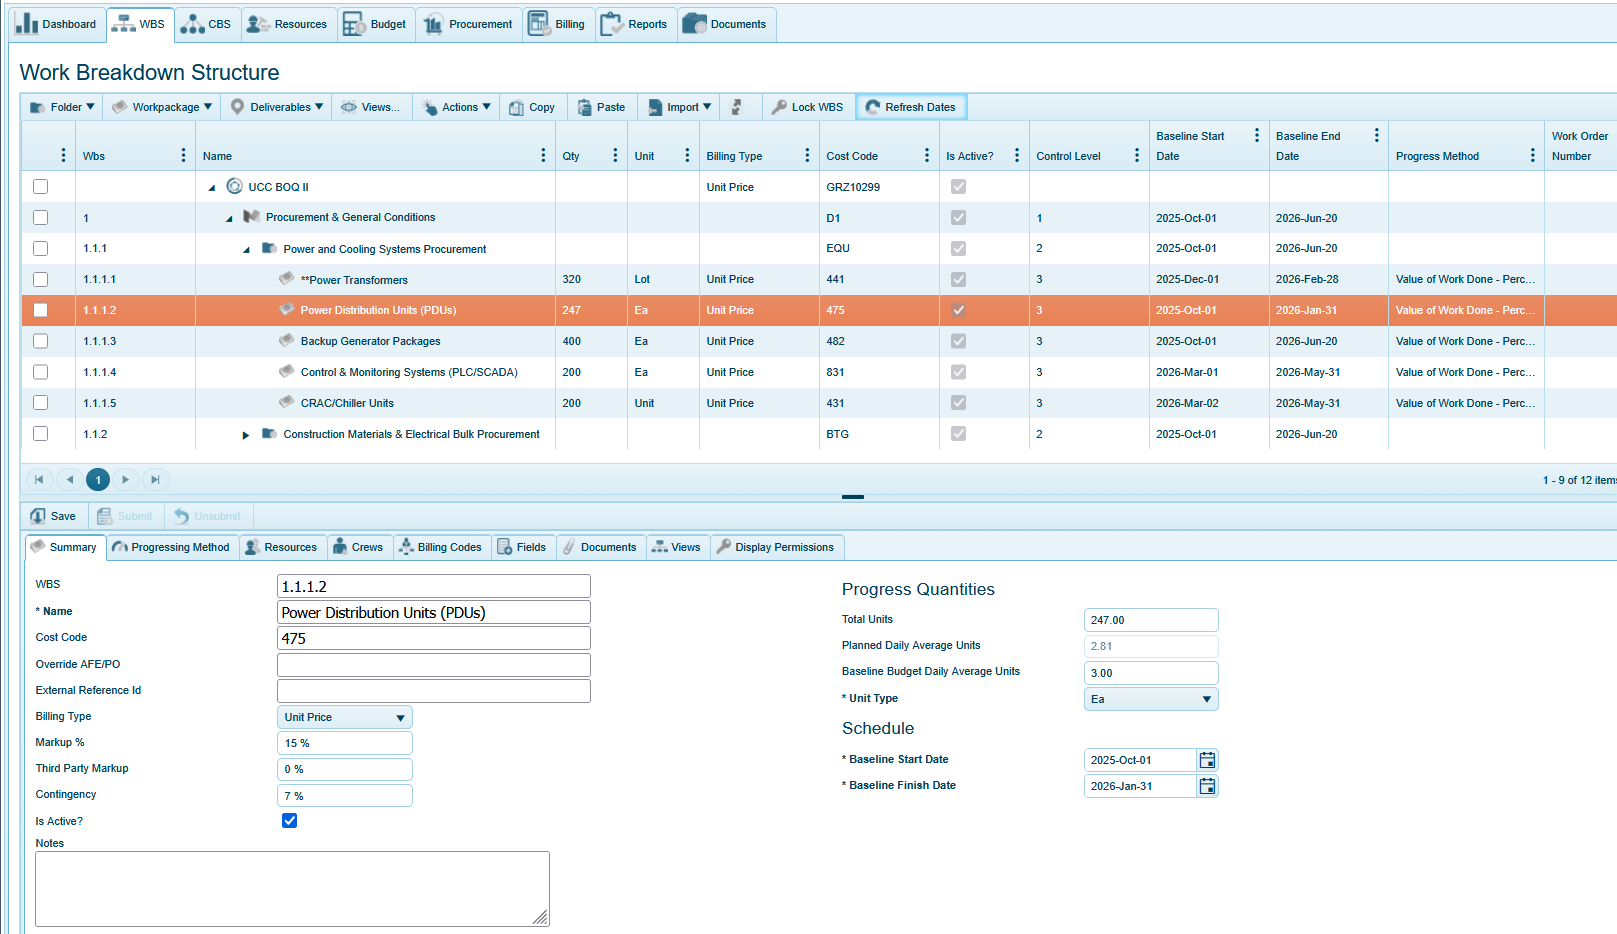
The 4castplus screenshot above shows the WBS planning area of a project. This is where project managers can define the plan, schedule, resourcing, etc. for every work package on a project. The details of the selected work package (1.1.1.2) are displayed in the bottom half of the screen. You can see that 247 units of type “Ea” – for each – have been budgeted for that item. Notice also that there are two fields for “Daily Average Units”: Planned and Budgeted. The value for the planned daily average is automatically calculated by the system. This is calculated by taking the total number of scheduled workdays (as defined in the scheduled start/finish dates) and dividing that number by the number of units – 247. In this example, that number comes to 2.81 per day. The value for budgeted daily average is where you can enter a value for the contractual obligation for daily average. This can be seen as a stretch target or an agreed value between you and your subcontractor or client. The nice thing about being able to define these planned daily units, is that it provides a key metric for tracking against the actual quantity completed on a daily basis. This enables the system to produce various productivity metrics.
1.2 Productivity Metrics
In the above example, we’ve entered a target of 3.00 Ea per day. Then, as the actuals get tracked, we’ll be able to compare the average actual against the budgeted to determine if we’re on track.
Additionally, because we’re also tracking hours and cost to the same workpackage we’re tracking units, the system can utilize these input values to calculate further productivity metrics. Including:
- Total actual unit quantity to date
- Budgeted unit cost
- Actual unit cost
- Planned units per day
- Actual units per day
- Productivity factor
- Unit productivity index
- Budgeted hours-per-unit
- Actual hours-per-unit
- Actual units-per-hour
With these built-in productivity metrics, it’s clear where things are performing to plan, and where they’re falling behind.
1.3 Production Timeline
Since these unit quantities are tied to a schedule, the system can produce a production timeline that shows how the unit progress is playing out against the plan in a chart format.
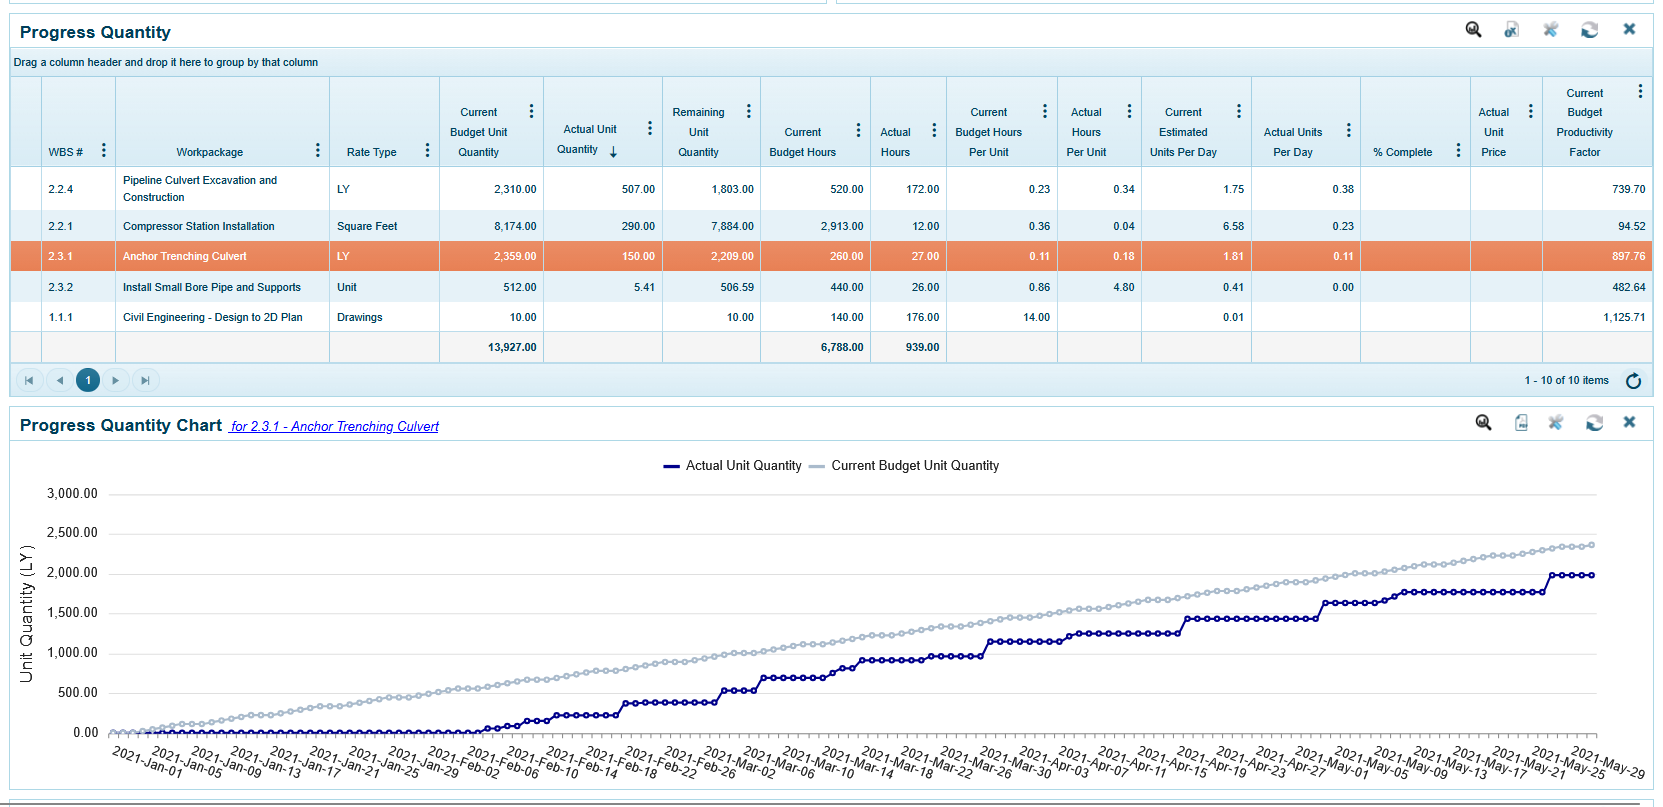
The 4castplus screenshot above shows the budget versus actual quantities for the selected workpackage (2.3.1). You can see the budgeted quantity timeline in the gray compared to the actual quantity timeline in the blue.
1.4 Progress Metrics
Using production quantities for calculating percent complete on a work package is another crucial purpose for tracking quantities. When comparing the budgeted quantity with the actual quantity, that implies a percentage of completion in terms of quantity complete. This is a common progress method in 4castplus, where it’s the units that will provide the mechanism of measuring progress. If, for example, you have 400 units to complete, and you’ve successfully completed 200 units, you can reasonably assess that the work package is 50% complete.
Learn More
Want to see how 4castplus helps teams control jobsite costs in real time? From daily field reporting and labor tracking to integrated cost control and change management, 4castplus connects field activity directly to project budgets. Gain real-time visibility into actuals vs. planned costs, catch overruns early, and keep projects profitable and on track—schedule a demo or learn more today.